Income reports
What YouTube Studio showed six creators about their revenue.
Each report covers one video in which a creator opened their own YouTube Studio analytics on camera. Software read the numbers from those screens and kept the exact moment each one appears. Nothing is typed in by hand. Every revenue figure is the “Estimated revenue” Studio displays, not a payout.
- 202
- figures on screen
- 6
- creators
- 66
- matched to a second on-screen figure or sum
Reports
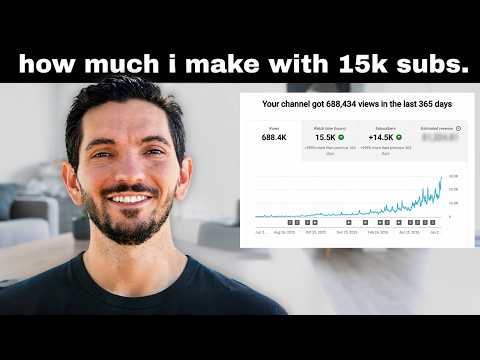
Travis Nicholson
How Much YouTube Pays My Small Channel in 2026
$1,239.25
Studio’s estimated revenue, Jan 1 – Jun 26, 2026
22 figures, 14 cross-checked. Video published Jun 27, 2026.
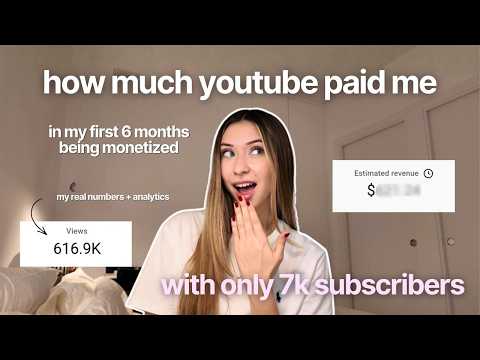
Liza
How Much Youtube Paid Me My First 6 Months Being Monetized With Only 7k Subscribers
$620.29
Studio’s estimated revenue, Jan 3, 2025 – Mar 21, 2026 · Lifetime
96 figures, 26 cross-checked. Video published Mar 23, 2026.
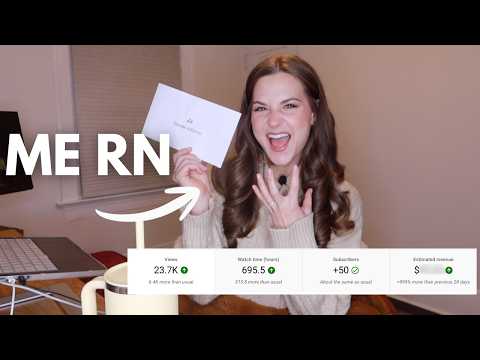
Elise Poret
**realistic** HOW MUCH YOUTUBE PAID ME MY FIRST MONTH MONETIZED IN 2026 (as a small creator)
$41.70
Studio’s estimated revenue, Oct 27, 2025 – Jan 24, 2026 · Last 90 days
5 figures, 3 cross-checked. Video published Feb 22, 2026.
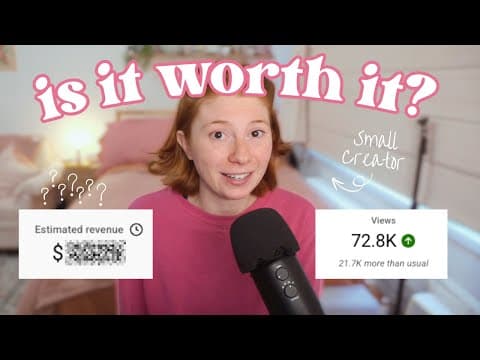
Emily Elizabeth
How Much I Make on YouTube With Under 10K Subscribers | Real Numbers + Strategy
$3,712.49
Studio’s estimated revenue, Aug 26, 2020 – Jan 7, 2026 · Lifetime
26 figures, 7 cross-checked. Video published Jan 12, 2026.
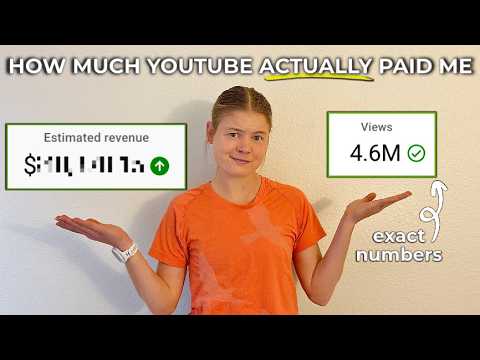
Allie Ostrander
How Much YouTube Actually Paid Me in 2025 || my exact income & analytics
$119,089.17
Studio’s estimated revenue, Aug 26, 2015 – Dec 30, 2025
21 figures, 8 cross-checked. Video published Jan 2, 2026.
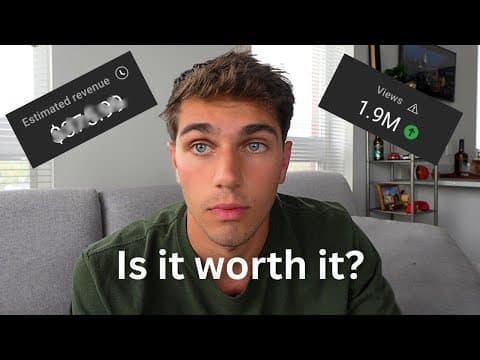
Reno James
How much YouTube pays me for 10,000 subscribers...
$610.82
Studio’s estimated revenue, Mar 10 – Jun 7, 2025 · Last 90 days
32 figures, 8 cross-checked. Video published Jun 8, 2025.
Revenue per 1,000 views, as Studio displayed it.
One RPM panel per creator, chosen by rule: the panel that shows its own date range, whose figures agree with the rest of the screen, and that covers the most views. The periods are not the same, so this is the range of what creators saw, not a league table.
Emily Elizabeth
2025
$10.67
Liza
Aug 1 – Sep 1, 2025
$3.92
Reno James
Last 90 days
$3.74
Travis Nicholson
2026
$3.03
Elise Poret
Last 90 days
$1.65
Table view
| Creator | RPM | Note |
|---|---|---|
| Emily Elizabeth | $10.67 | 2025 |
| Liza | $3.92 | Aug 1 – Sep 1, 2025 |
| Reno James | $3.74 | Last 90 days |
| Travis Nicholson | $3.03 | 2026 |
| Elise Poret | $1.65 | Last 90 days |
How the figures are made
Software that reads images (a vision model) reads the Studio cards, panels and charts in each video. Each figure keeps its timestamp, the period it covers and the currency the screen showed, and is matched to a second on-screen figure or sum where one exists. Estimated revenue is YouTube’s estimate, not a payout.
Read the methodEvery figure in one table
The full record table lists all 202public figures from the six creators’ videos, with period, status and the open discrepancies stated next to each one. A seventh video was read and is kept off the public pages; the methodology says why.
Open the full table
Published by Seokyoung Oh, publisher and data editor. Figures are read by software from each creator's own screen and linked to the moment they appear; no figure is edited by hand.
Figures read September 15, 2026. Page updated October 28, 2026.
Corrections
- . The table view under the RPM chart was headed “Estimated revenue”; the values are RPM, and the column now says so.